Reporting produces the tangible work product of diagnostic radiologists. Reports should reflect the expertise of the radiologist while clearly communicating complex information for ordering providers.
Over time, many elements of radiologists’ workflow have kept pace with and adapted to technological advancements in the industry. But for various reasons, radiologists continue to complete reporting the same way they have for decades — in a standard plain text format.
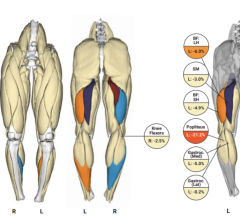
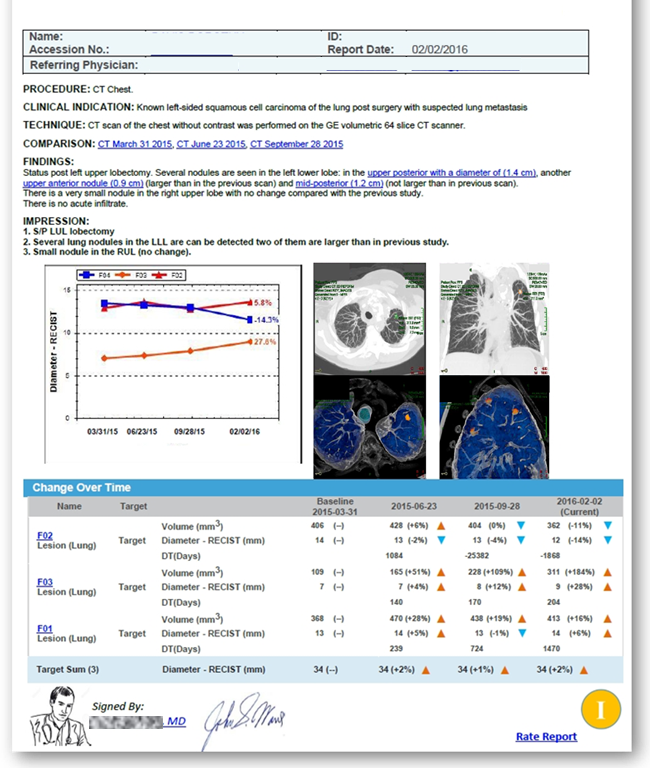
An updated method of reporting, known as interactive multimedia reporting, enables the radiologist to insert enhanced content, such as images, charts, graphs and interactive hyperlinks to annotated findings, directly into reports. These multimedia elements can then be accessed by downstream consumers, allowing the referring physician or patient a more interactive and comprehensive experience.
“It's really about updating the way we report to modern electronic communication methods to take advantage of those tools that are already used widely in other industries,” said Cree Gaskin, M.D., vice chair of clinical operations and informatics, division chief of musculoskeletal imaging and intervention, and associate chief medical information officer at the University of Virginia (UVA). UVA implemented early-stage interactive multimedia reporting to their clinical environment in 2016 and continue to update technology for more advanced reporting.
Clinical Benefits
In addition to providing a more robust report for the consumer, an interactive reporting system also allows for efficient entry of information into the report. A radiologist can measure a finding and then issue a voice command to connect that finding to the report via a hyperlink. Information about a lesion location, such as image number, series number and measurement, will automatically transfer from the viewer into the reporting application and then into the report. Similarly, details of prior studies being viewed for comparison can also be automatically inserted.
“The ability to have information automatically import from the images into the report itself is an advantage because you don't have to dictate all of that content,” Gaskin said. “If you're looking at the images, and you want some of that information to end up in the report, you can use commands to automatically import certain information without having to dictate it. It's less labor of dictation, and less likely to have a voice transcription error, or speech recognition error.”
The addition of images, graphs and hyperlinks into reports enriches the reporting experience, and more effectively communicates results by providing easier and more direct access to imaging than plain text. Anecdotal evidence from providers shows that embedded images and hyperlinks to annotated images make the reports clearer about which findings are being discussed.
When the ordering provider clicks a hyperlink in the report, it launches the viewer. The viewer displays the relevant annotated image from the study and the image stack is scrollable to view adjacent images. The interactive report is also displayed, allowing access to other hyperlinked findings. This helps the clinician quickly and easily navigate between the report and images, increasing both confidence and efficiency during report review.
“I review a lot of reports myself. When reading current studies, I’ll review the prior studies and their reports for comparison. It is faster for me to click on a link in the prior report and immediately see the key finding on the prior study,” Gaskin said. “Even though I'm capable of finding it, it might take me eight seconds or so, or I can click a link and see it instantly. So it's pretty obvious that it's time saving, for anyone consuming the report.”
Interactive Reporting In COVID-19
When the COVID-19 pandemic began and faculty radiologists began to have fewer in-person interactions with referring providers and trainees, UVA was able to prepare the same interactive reports remotely in their Philips Vue PACS system. The team at UVA also relied on screen sharing to collaborate with colleagues, read a resident out remotely or perform consultations for ordering providers.
“Pre-COVID, I would sit next to the trainee and go over the findings with him or her in person. Now that I'm sometimes remote, we're not always side-by-side during readout sessions. I may just read their reports while interpreting the images. If they've inserted a hyperlink to a finding, I can more quickly and confidently see exactly what they're talking about,” Gaskin said.
Creating New Workflow Habits
From a radiologist’s workflow perspective, Gaskin estimates that the time needed to prepare interactive reports is equal to plain text reporting. Because the shift to interactive reporting does require radiologists to learn a new workflow, the components that are neutral or beneficial to workflow are the most likely to be adopted. In Gaskin’s experience, trainees who have fewer ingrained habits are more likely to embrace the new approach.
“If you've been doing it a certain way for 15 years, you have to think a little bit differently,” Gaskin said. “The more you use it, the more natural it becomes.”
In a 2018 study1 published in the Journal of the American College of Radiology, researchers at UVA reviewed more than 559,000 diagnostic reports over a 20-month period for the presence of active hyperlinks in clinical imaging reports. The study found that more complex examples, like PET CT, had nearly half of reports containing hyperlinks to key findings.
“I think that’s pretty strong adoption to say that half of the reports had this elective new tool used,” Gaskin said. “That reflects that radiologists see value in doing it, and that it's not a significant burden.”
Economic and Patient Benefits
There is also economic advantage to interactive reporting, for both radiologists and ordering physicians. Interactive reports allow for expedited report and image review. Radiologists can report results faster, and providers are able to consume them more quickly and with potentially greater understanding. In a competitive market, this can offer a strategic advantage.
“If you are a clinical radiology group issuing reports, there's a competitive advantage to having a superior product,” Gaskin said. “If one radiology group in town provides reports that are interactive, and have key images within them, they look more sophisticated.”
Gaskin said the same holds true for the patients. UVA embedded links to their images and interactive radiology reports into Epic MyChart, allowing patients to review and share their Interactive Multimedia Reports and associated findings marked on live images through the hospital's patient portal. Within five months of launch, UVA saw a 7x increase2 in patients accessing their own radiology images and interactive reports online.
“Patients are able to interact with the report and see the images, helping them to better understand what the radiologist is saying. Supporting patient engagement like this can improve satisfaction and care delivery. Patients can choose where they go to receive outpatient imaging, and they may prefer a site that provides easy access to online images and interactive multiple reports.”
Barriers to Implementation
One of the biggest limitations to implementing interactive reporting is interoperability. It is technically more difficult to seamlessly integrate and share content between separate viewing and reporting applications. One overarching application that combines both viewing and reporting functions into one, provides a much easier pathway for sharing content between the viewer and the reporting application.
Similarly, applications further downstream or outside of the radiologist workflow need an effective method for translating multimedia material. Some electronic health records (EHRs) may only be configured to intake plain text, or require a separate viewer to display interactive multimedia reports that are issued in one system and consumed or displayed in another.
“I think it's important to know that we're right on the edge of enabling that to work in the EHR itself, and once we complete that, there really are not any real remaining barriers,” Gaskin said. “You're going to see providers consistently seeing interactive multimedia reports in the EHR. Once that technical hurdle is completed, then we can pretty much expect our advanced reports will always reach our referring providers.”
Gaskin believes this will accelerate the cycle of cultural adoption for providers, who will begin to expect more interactive reporting.
“I'm confident that as they see more reports with interactive content, they'll recognize their time savings,” he said.
Results from case studies are not predictive of results in other cases. Results in other cases may vary.
For more information: www.philips.com/multimedia-reporting
References:
- https://doi.org/10.1016/j.jacr.2018.10.009. Radiologist Adoption of Interactive Multimedia Reporting Technology. Journal of the American College of Radiology 2018
- https://doi.org/10.1016/j.jacr.2020.12.028. Improving Patient Access to Medical Images by Integrating an Imaging Portal With the Electronic Health Record Patient Portal. Journal of the American College of Radiology 2021


 February 03, 2025
