September 18, 2019 — Although Medicare claims data confirm the increasing role of nurse practitioners and physician assistants (NPPs) in imaging-guided procedures across the United States, a recently published article finds NPPs still rarely render diagnostic imaging services compared with the overall number of diagnostic imaging interpretations. When NPPs do render diagnostic imaging services, though, said services are overwhelmingly radiography and fluoroscopy.
The article was published ahead of print in the November issue of the American Journal of Roentgenology (AJR).[1]
Whereas considerable state-to-state variation exists in the rates in which NPPs render diagnostic imaging services, the article states, these rates are also uniformly low — likely due, in part, to unique scope-of-practice laws and regulations at the state level.
“At present,” Emory University researcher Valeria Makeeva noted, “the near-term likelihood of NPPs appropriating substantial market share in diagnostic imaging is very low.”
Utilizing 1994–2015 Medicare Physician/Supplier Procedure Summary Master Files, Makeeva and colleagues identified all diagnostic imaging services, including those billed by NPPs, and cataloged them by modality and body region. Then, using 2004–2015 Medicare Part B 5% Research Identifiable File Carrier Files, they separately assessed state-level variation in imaging services rendered by NPPs. Total and relative utilization rates were calculated annually.
Nationally, between 1994 and 2015, diagnostic imaging services increased from 339,168 to 420,172 per 100,000 Medicare beneficiaries — an increase of 24 percent. During this same period, diagnostic imaging services rendered by NPPs increased 14,711 percent (from 36 to 5,332 per 100,000 beneficiaries), yet still represented a mere 0.01 percent and 1.27 percent of all imaging in 1994 and 2015, respectively.
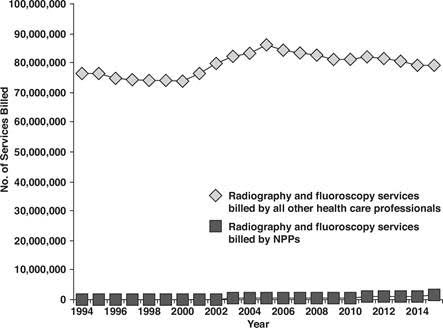
Across all years, radiography and fluoroscopy constituted most of the NPP-billed imaging services and remained constant over time (e.g., 94 percent of all services billed in 1994 and 2015), representing only 0.01 percent and 2.1 percent of all Medicare radiography and fluoroscopy services. However, absolute annual service counts for NPP-billed radiography and fluoroscopy services increased from 10,899 to 1,665,929 services between 1994 and 2015 (Fig. 1).
A.
B.
Fig. 1—Year-to-year annual changes in billed Medicare fee-for-service for diagnostic imaging services by nonphysician providers (NPPs) by modality (radiography and fluoroscopy vs other imaging services) from 1994 to 2015.
A. Bar graph compares radiography and fluoroscopy services billed by NPPs with other imaging services billed by NPPs.
B. Graph compares radiography and fluoroscopy services billed by NPPs with all radiography and fluoroscopy services billed by physicians and all other health care professionals.
Makeeva’s team found that NPP-billed imaging was most common in South Dakota (7,987 services per 100,000 beneficiaries) and Alaska (6,842 services per 100,000 beneficiaries) and was least common in Hawaii (231 services per 100,000 beneficiaries) and Pennsylvania (478 services per 100,000 beneficiaries).
Acknowledging the growth in procedural, evaluation, management and diagnostic services suggests a need for standardized, narrowly focused, highly supervised and imaging-specific training programs for these professionals — such as those that exist for radiologic technologists aspiring to become radiologist assistants. Makeeva also noted, “Our work shows the need for NPP employers to consider formally defining potential NPP roles within radiology services through NPP training programs that comport with NPP scope of practice in their specific states.”
For more information: www.ajronline.org
Reference
1. Makeeva V., Hawkins C.M., Rosenkrantz A.B., et al. Diagnostic Imaging Examinations Interpreted by Nurse Practitioners and Physician Assistants: A National and State-Level Medicare Claims Analysis. American Journal of Roentgenology, November 2019. https://doi.org/10.2214/AJR.19.21306

 July 30, 2024
